Update 2 (Mar 16, 2011): Second run of Varnish benchmark added
Update 3 (Mar 16, 2011): Cherokee benchmark added
Update 4 (Mar 25, 2011): New benchmark with the optimized settings is available
Introduction
Apache is the de facto web server on Unix system. Nginx is nowadays a popular and performant web server for serving static files (i.e. static html pages, CSS files, Javascript files, pictures, …). On the other hand, Varnish Cache is increasingly used to make websites “fly” by caching static content in memory. Recently, I came across a new application server called G-WAN. I’m only interested here in serving static content, even if G-WAN is also able to serve dynamic content, using ANSI C scripting. Finally, I also included Cherokee in the benchmark.Setup
The following version of the software are used for this benchmark:- Apache MPM-worker: 2.2.16-1ubuntu3.1 (64 bit)
- Apache MPM-event: 2.2.16-1ubuntu3.1 (64 bit)
- Nginx: 0.7.67-3ubuntu1 (64 bit)
- Varnish: 2.1.3-7ubuntu0.1 (64 bit)
- G-WAN: 2.1.20 (32 bit)
- Cherokee: 1.2.1-1~maverick~ppa1 (64 bit)
Benchmark setup
- HTTP Keep-Alives: enabled
- TCP/IP settings: OS default
- Server settings: default
- Concurrency: from 0 to 1’000, step 10
- Requests: 1’000’000
XXXXXXXXXXXXXXXXXXXXXXXXXXXXXXXXXXXXXXXXXXXXXXXXXXXXXXXXXXXXXXXXXXXXXXXXXXXXXXXXXXXXXXXXXXXXXXXXXXDisclaimer
Doing a correct benchmark is clearly not an easy task. There are many walls (TCP/IP stack, OS settings, the client, …) that may corrupt the results, and there is always the risk to compare apples with oranges (e.g. benchmarking the TCP/IP stack instead of the server itself).
In this benchmark, every server is tested using its default settings. The same applies for the OS. Of course, on a production environment, each setting will be optimized. This has been done in a second benchmark. If you have comments, improvements, ideas, please feel free to contact me, I’m always open to improve myself and to learn new things.
Client
The client (available here: http://gwan.ch/source/ab.c.txt) relies on ApacheBench (ab). The client as well as the web server tested are hosted on the same computer.Apache (MPM-worker)
Configuration
Relevant part of file /etc/apache2/apache2.confStartServers 2
MinSpareThreads 25
MaxSpareThreads 75
ThreadLimit 64
ThreadsPerChild 25
MaxClients 150
MaxRequestsPerChild 0
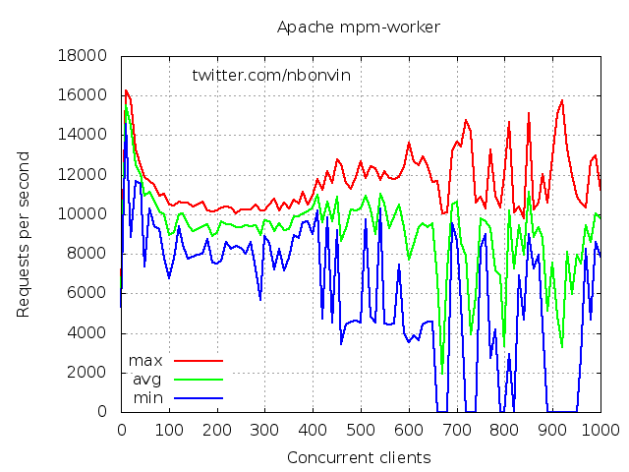
Benchmark results
The benchmark took 1174 seconds in total.
Apache (MPM-event)
Configuration
Relevant part of file /etc/apache2/apache2.confStartServers 2
MaxClients 150
MinSpareThreads 25
MaxSpareThreads 75
ThreadLimit 64
ThreadsPerChild 25
MaxRequestsPerChild 0
Benchmark results
The benchmark took 1904 seconds in total.
Nginx
Configuration
File /etc/nginx/nginx.confuser www-data;
worker_processes 1;
error_log /var/log/nginx/error.log;
pid /var/run/nginx.pid;
events {
worker_connections 1024;
# multi_accept on;
}
http {
include /etc/nginx/mime.types;
access_log /var/log/nginx/access.log;
sendfile on;
#tcp_nopush on;
#keepalive_timeout 0;
keepalive_timeout 65;
tcp_nodelay on;
gzip on;
gzip_disable "MSIE [1-6]\.(?!.*SV1)";
include /etc/nginx/conf.d/*.conf;
include /etc/nginx/sites-enabled/*;
}
File /etc/nginx/sites-enabled/defaultserver {
listen 80; ## listen for ipv4
server_name localhost;
access_log /var/log/nginx/localhost.access.log;
location / {
root /var/www;
index index.html index.htm;
}
}
Benchmark results
The benchmark took 1048 seconds in total.Varnish
Varnish uses Nginx as backend. However, only one request every 2 minutes hits Nginx, the other requests are served directly by Varnish.Configuration
File /etc/varnish/default.vclbackend default {
.host = "127.0.0.1";
.port = "80";
}
File /etc/default/varnishSTART=yes
NFILES=131072
MEMLOCK=82000
INSTANCE=$(uname -n)
DAEMON_OPTS="-a :6081 \
-T localhost:6082 \
-f /etc/varnish/default.vcl \
-S /etc/varnish/secret \
-s file,/var/lib/varnish/$INSTANCE/varnish_storage.bin,1G"
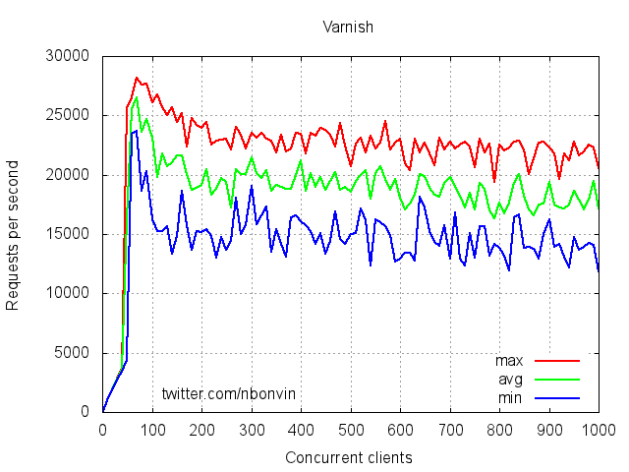
Benchmark results
Run: 1The benchmark took 1297 seconds in total.

Run: 2
The benchmark took 1313 seconds in total.

As some people requested more details regarding the benchmark of Varnish, here is the output of varnishstat -1:
client_conn            504664       281.31 Client connections accepted
client_drop                 0         0.00 Connection dropped, no sess/wrk
client_req           20245482     11285.11 Client requests received
cache_hit            20245471     11285.10 Cache hits
cache_hitpass               0         0.00 Cache hits for pass
cache_miss                 11         0.01 Cache misses
backend_conn               11         0.01 Backend conn. success
backend_unhealthy            0         0.00 Backend conn. not attempted
backend_busy                0         0.00 Backend conn. too many
backend_fail                0         0.00 Backend conn. failures
backend_reuse               0         0.00 Backend conn. reuses
backend_toolate            10         0.01 Backend conn. was closed
backend_recycle            11         0.01 Backend conn. recycles
backend_unused              0         0.00 Backend conn. unused
fetch_head                  0         0.00 Fetch head
fetch_length                0         0.00 Fetch with Length
fetch_chunked              11         0.01 Fetch chunked
fetch_eof                   0         0.00 Fetch EOF
fetch_bad                   0         0.00 Fetch had bad headers
fetch_close                 0         0.00 Fetch wanted close
fetch_oldhttp               0         0.00 Fetch pre HTTP/1.1 closed
fetch_zero                  0         0.00 Fetch zero len
fetch_failed                0         0.00 Fetch failed
n_sess_mem               2963          .   N struct sess_mem
n_sess                   1980          .   N struct sess
n_object                    0          .   N struct object
n_vampireobject             0          .   N unresurrected objects
n_objectcore              393          .   N struct objectcore
n_objecthead              393          .   N struct objecthead
n_smf                       2          .   N struct smf
n_smf_frag                  0          .   N small free smf
n_smf_large                 2          .   N large free smf
n_vbe_conn                  1          .   N struct vbe_conn
n_wrk                     396          .   N worker threads
n_wrk_create              500         0.28 N worker threads created
n_wrk_failed                0         0.00 N worker threads not created
n_wrk_max              118979        66.32 N worker threads limited
n_wrk_queue                 0         0.00 N queued work requests
n_wrk_overflow         133755        74.56 N overflowed work requests
n_wrk_drop                  0         0.00 N dropped work requests
n_backend                   1          .   N backends
n_expired                  11          .   N expired objects
n_lru_nuked                 0          .   N LRU nuked objects
n_lru_saved                 0          .   N LRU saved objects
n_lru_moved               557          .   N LRU moved objects
n_deathrow                  0          .   N objects on deathrow
losthdr                  7470         4.16 HTTP header overflows
n_objsendfile               0         0.00 Objects sent with sendfile
n_objwrite           20215571     11268.43 Objects sent with write
n_objoverflow               0         0.00 Objects overflowing workspace
s_sess                 504664       281.31 Total Sessions
s_req                20245482     11285.11 Total Requests
s_pipe                      0         0.00 Total pipe
s_pass                      0         0.00 Total pass
s_fetch                    11         0.01 Total fetch
s_hdrbytes         5913383706   3296200.51 Total header bytes
s_bodybytes         526382532    293412.78 Total body bytes
sess_closed            382711       213.33 Session Closed
sess_pipeline               0         0.00 Session Pipeline
sess_readahead              0         0.00 Session Read Ahead
sess_linger          20245482     11285.11 Session Linger
sess_herd              124222        69.24 Session herd
shm_records         689986796    384608.02 SHM records
shm_writes           21885539     12199.30 SHM writes
shm_flushes                 0         0.00 SHM flushes due to overflow
shm_cont               282730       157.60 SHM MTX contention
shm_cycles                200         0.11 SHM cycles through buffer
sm_nreq                    22         0.01 allocator requests
sm_nobj                     0          .   outstanding allocations
sm_balloc                   0          .   bytes allocated
sm_bfree           1073741824          .   bytes free
sma_nreq                    0         0.00 SMA allocator requests
sma_nobj                    0          .   SMA outstanding allocations
sma_nbytes                  0          .   SMA outstanding bytes
sma_balloc                  0          .   SMA bytes allocated
sma_bfree                   0          .   SMA bytes free
sms_nreq                    0         0.00 SMS allocator requests
sms_nobj                    0          .   SMS outstanding allocations
sms_nbytes                  0          .   SMS outstanding bytes
sms_balloc                  0          .   SMS bytes allocated
sms_bfree                   0          .   SMS bytes freed
backend_req                11         0.01 Backend requests made
n_vcl                       1         0.00 N vcl total
n_vcl_avail                 1         0.00 N vcl available
n_vcl_discard               0         0.00 N vcl discarded
n_purge                     1          .   N total active purges
n_purge_add                 1         0.00 N new purges added
n_purge_retire              0         0.00 N old purges deleted
n_purge_obj_test            0         0.00 N objects tested
n_purge_re_test             0         0.00 N regexps tested against
n_purge_dups                0         0.00 N duplicate purges removed
hcb_nolock           20219699     11270.74 HCB Lookups without lock
hcb_lock                    1         0.00 HCB Lookups with lock
hcb_insert                  1         0.00 HCB Inserts
esi_parse                   0         0.00 Objects ESI parsed (unlock)
esi_errors                  0         0.00 ESI parse errors (unlock)
accept_fail                 0         0.00 Accept failures
client_drop_late            0         0.00 Connection dropped late
uptime                   1794         1.00 Client uptime
G-WAN
Configuration
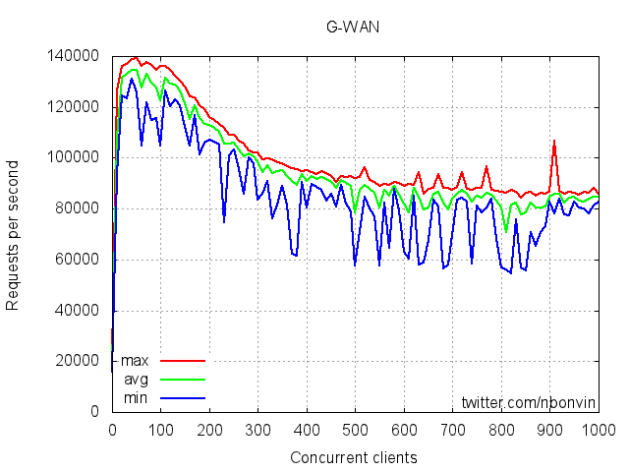
The configuration of G-WAN is done through the file hierarchy. Therefore, unzipping the G-WAN archive was enough to have a fully working server.Benchmark results
The benchmark took 607 seconds in total.
Cherokee
Configuration
Relevant part of file /etc/cherokee/cherokee.conf# Server # server!bind!1!port = 80 server!timeout = 15 server!keepalive = 1 server!keepalive_max_requests = 500 server!server_tokens = full server!panic_action = /usr/share/cherokee/cherokee-panic server!pid_file = /var/run/cherokee.pid server!user = www-data server!group = www-data # Default virtual server # vserver!1!nick = default vserver!1!document_root = /var/www vserver!1!directory_index = index.html
Benchmark results
The benchmark took 1068 seconds in total.
Discussion
Let’s now compare the minimum, the average and the maximum requests per second rate of each server.Minimum RPS

Average RPS

Maximum RPS

Conclusion
G-WAN is the clear winner of this benchmark, while Nginx and Varnish have simliar average performance. It’s not a real surprise to see Apache at the last position.- G-WAN can serve 2.25 times more requests per second on average compared to Cherokee, from 4.25 to 6.5 times compared to Nginx and Varnish, and from 9 to 13.5 times more than Apache.
- Nginx / Varnish can serve 2.1 times more requests per second on average compared to Apache.
- Nginx needs 1.73 more time to serve the same amount of requests compared to G-WAN.
- Varnish needs 2.14 more time to serve the same amount of requests compared to G-WAN.
- Apache needs 1.93 more time to serve a similar amount of requests compared to G-WAN (i.e. Apache sometimes replied with an error 503 and didn’t serve the exact same amount of requests).
REFERENCES
http://nbonvin.wordpress.com/2011/03/14/apache-vs-nginx-vs-varnish-vs-gwan/

